Insights
The Insights screen is the dedicated area for analytics and performance monitoring of your workspace. It brings together inventory metrics about your catalogue and end-user engagement metrics so you can understand both how your DPP catalogue looks and how end users interact with it.
Open Insights
- In the left navigation, select
Insights. - The page opens on the
Producttab by default and shows the configured cards and the filter bar at the top.
The two tabs: Product and Scans
Insights is organised into two tabs. Each tab focuses on a different lens of your workspace, and the filters plus Export Data action apply to whichever tab is currently active.
| Tab | What it shows |
|---|---|
| Product | Inventory and quality metrics about your catalogue: Overview Counts, Resource Usage, Passport Status Breakdown, Product Type Distribution, Alignment Status, and Template Status. |
| Scans | End-user engagement and access metrics: Top Scanned Products, Scans by Device, Scans by Day of Week, Scans by Region, and Passport Scans Over Time. |
Filters
The filter bar applies to every chart on the active tab in real time. The following filters are available:
Time range– All Time or a specific preset.Type– Narrow results to a specific content or product type.
Filter state persists while you navigate within Insights, and loading indicators are shown while data refreshes.
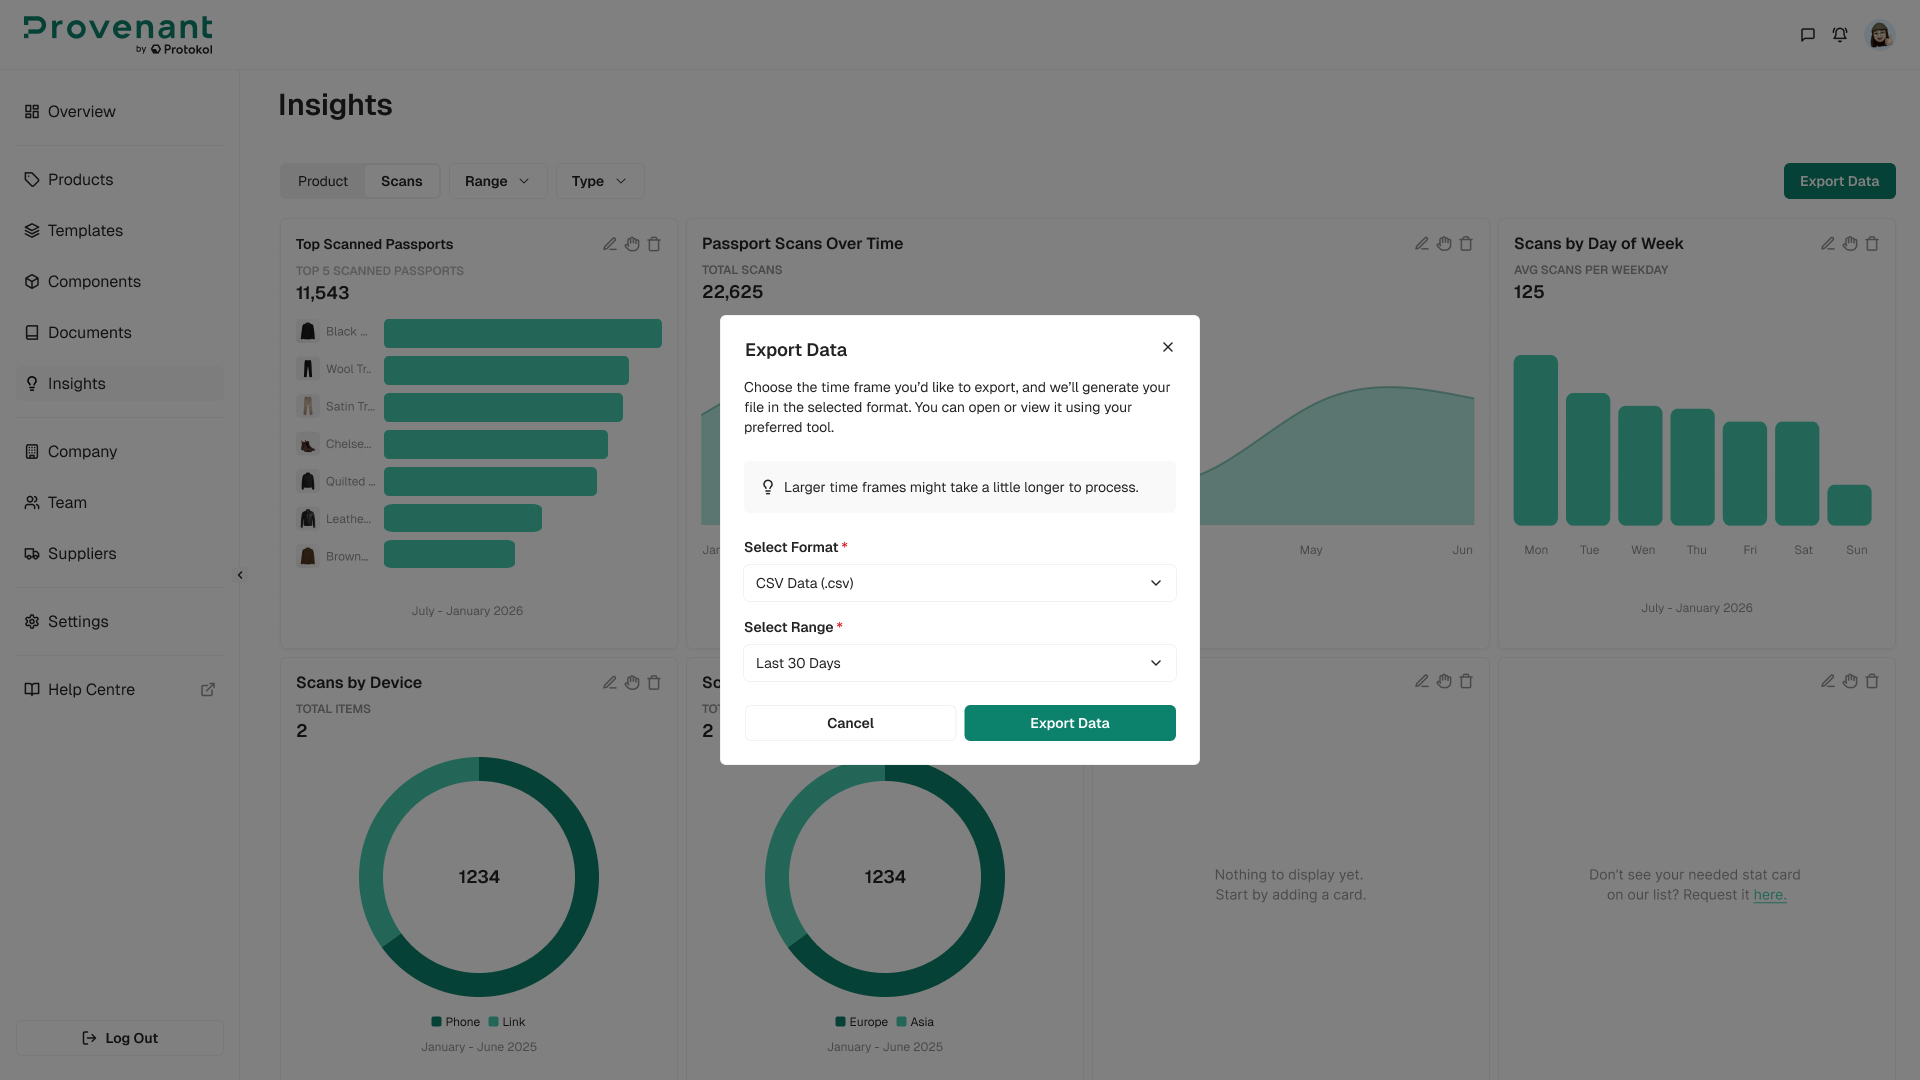
Export Data
Use the Export Data button at the top right of the Insights screen to download a report with the data shown in the visible cards. The export reflects the active tab and the current filter selection.
Customise your Insights
You can tailor which cards appear on each tab and how they are arranged. Each card has a set of action icons in its top right corner:
| Icon | Action |
|---|---|
| Pencil (edit) | Open the card configuration to change what it displays. |
| Hand (drag) | Drag the card to reorder it within the layout. |
| Trash (remove) | Remove the card from the screen. You can add it back later from the available cards list. |
Empty slots in the layout show “Nothing to display yet” so it is clear when a position is unused.
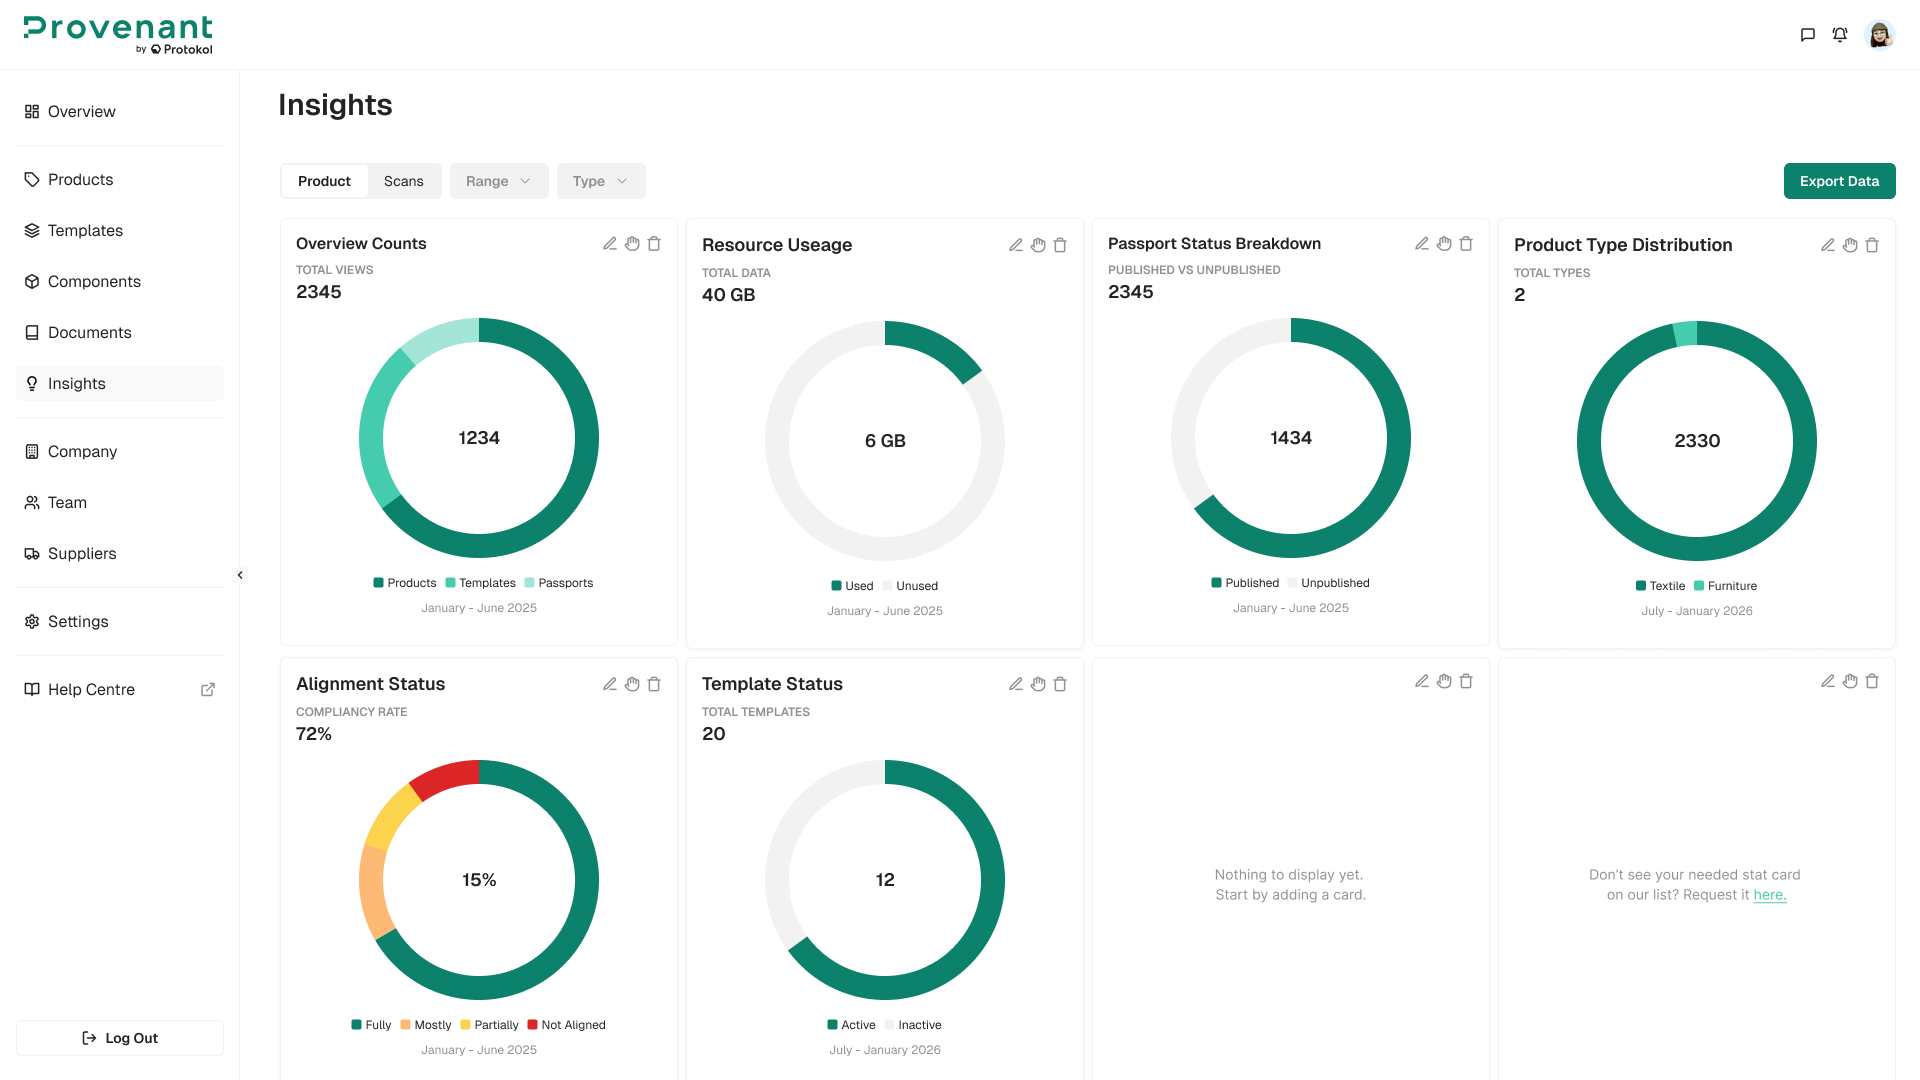
Product tab cards
| Card | What it shows |
|---|---|
| Overview Counts | Total views across the workspace with a donut breakdown by Products, Templates, and Passports. |
| Resource Usage | Total data with a Used vs Unused split. |
| Passport Status Breakdown | Total passports with a Published vs Unpublished split. |
| Product Type Distribution | Total product types with a donut breakdown by category (for example, Textiles, Construction, Furniture, Other). |
| Alignment Status | Workspace compliancy rate (%) with a breakdown by alignment status: Not Aligned, Partially Aligned, Mostly Aligned, Fully Aligned. |
| Template Status | Total templates available in the workspace with a breakdown by template type (for example, Model). |
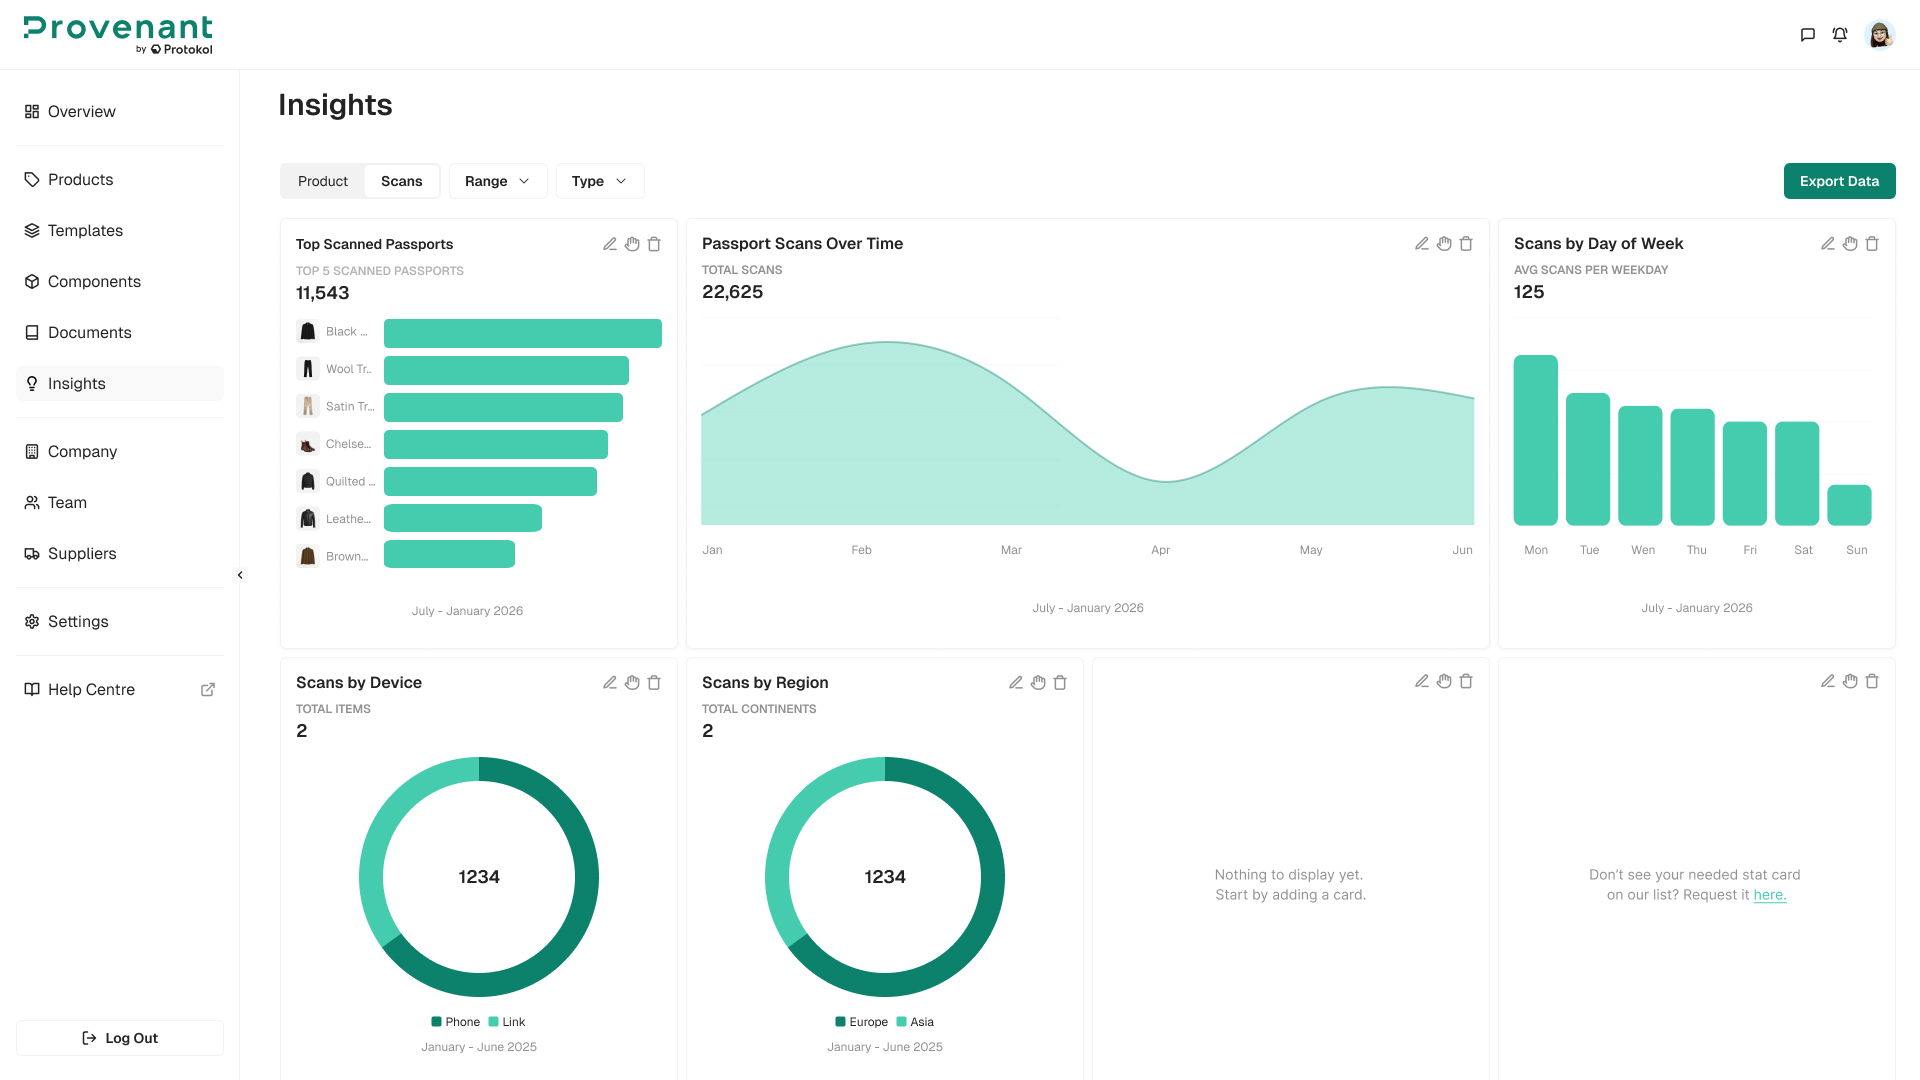
Scans tab cards
| Card | What it shows |
|---|---|
| Top Scanned Products | Horizontal bar chart with the top 5 most-scanned products (product image and name plus scan count). |
| Scans by Device | Donut with the breakdown by device type: Desktop, Mobile, Tablet, and Others. The total number of device categories is shown at the top of the card. |
| Scans by Day of Week | Bar chart with the average scans per weekday from Monday to Sunday. |
| Scans by Region | Donut breakdown of scans by country, with the total number of countries reached shown at the top of the card. |
| Passport Scans Over Time | Line chart showing total scans across the selected time range. |
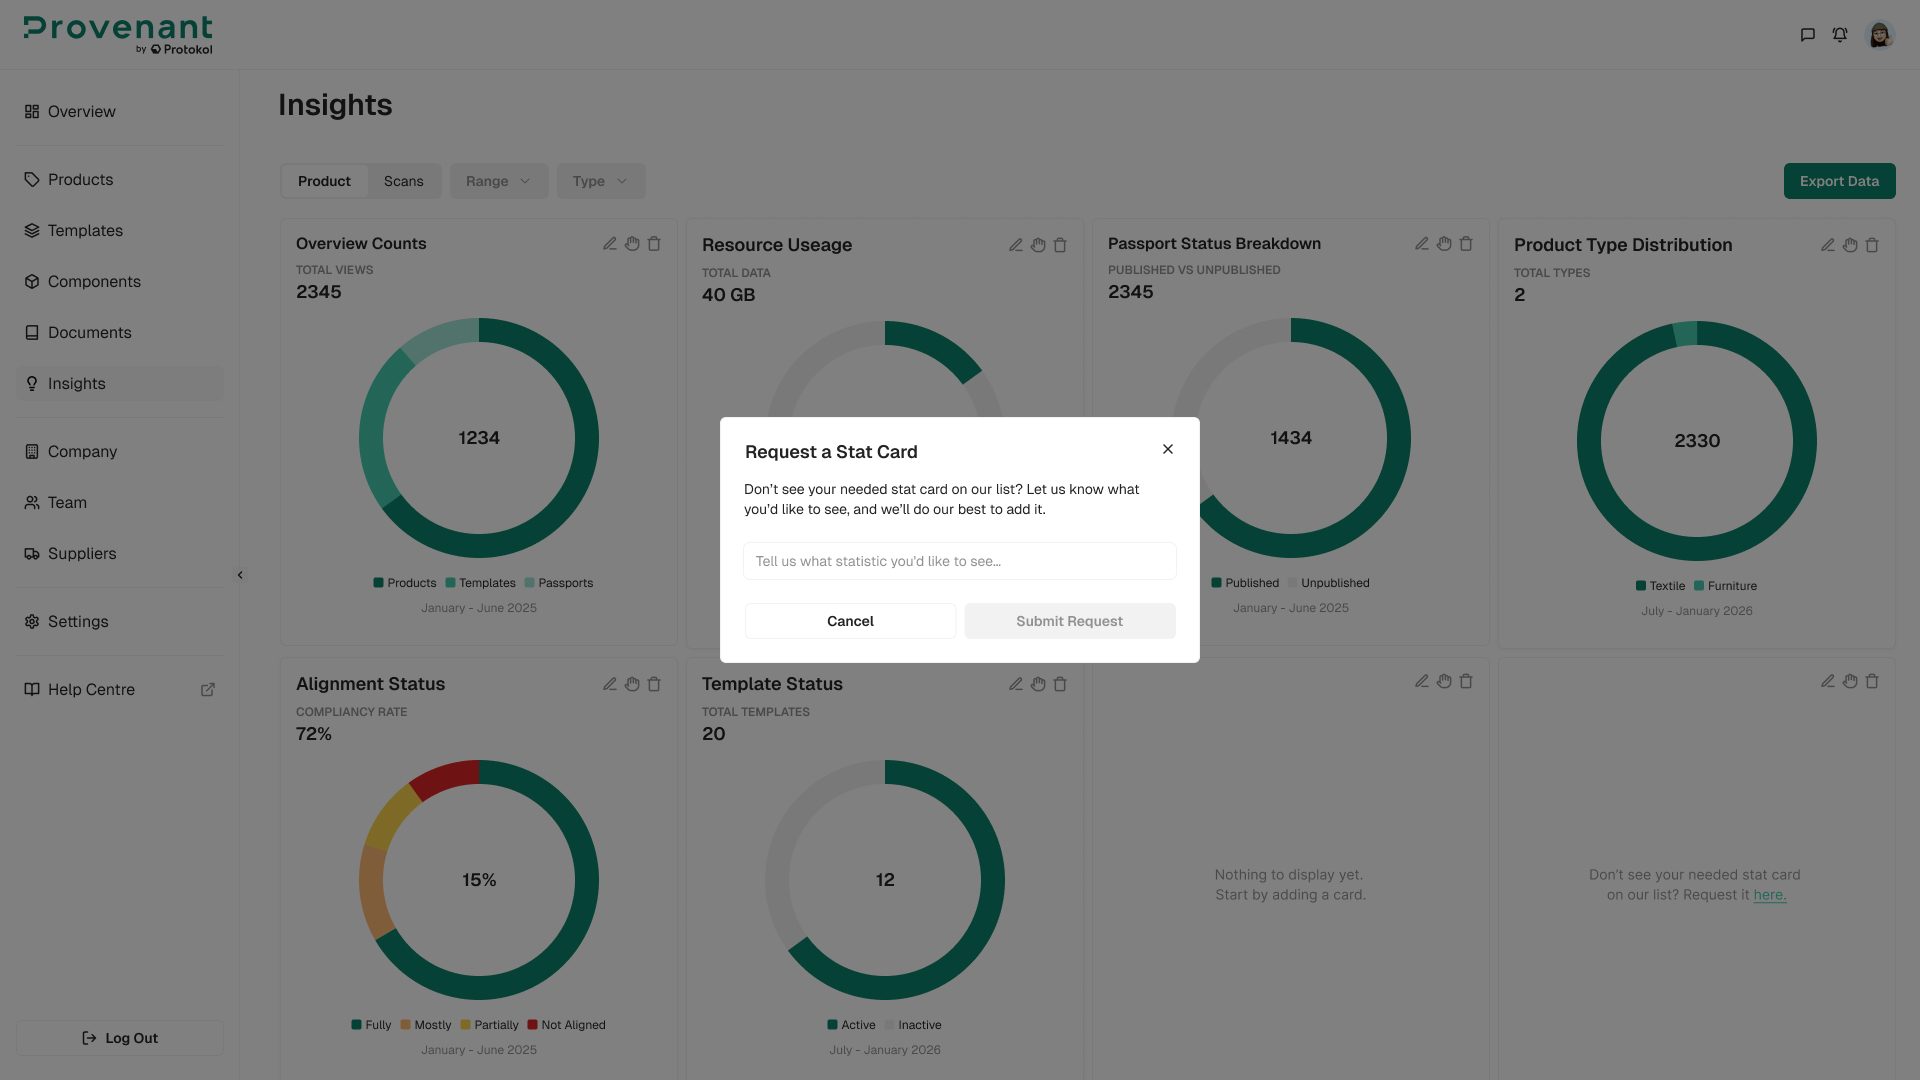
Request a new statistic
If you do not see a metric you need, use the “Don’t see your needed stat card on our list? Request it here.” prompt at the bottom of an empty card area. The product team reviews these requests to prioritise new analytics cards in future releases.
Privacy: Scan logging captures only the information required for analytics (such as region inferred from IP, and device type) and is handled in line with GDPR. IP values are anonymised where applicable.